Science-fair projectNear the bench
Delivery by design
Project title: Sound Wave–Assisted Rapid Respiratory Infectious Diseases Diagnosis
Science & Engineering Fair of Houston · research at the Huang Acoustofluidics Laboratory, Duke University · 2025–26
Eight projects between the bench and the market
Bench experiments, devices, measurementsMarket prices, sourcing, portfolios
Rapid tests for respiratory viruses are held back less by their chemistry than by a more basic problem: at the microscale, molecules find each other by diffusion, which is slow and unreliable, especially in a messy sample like saliva.
The platform behind this project came out of Duke’s Huang Acoustofluidics Laboratory. It uses sound to deliver target molecules to the reaction instead of waiting for them. My part was to understand it well enough to explain it to someone outside the lab: I fabricated and tested devices, ran the analysis, drew the figures, and took the project to the Science & Engineering Fair of Houston as a poster and a talk.
Sound as a delivery system
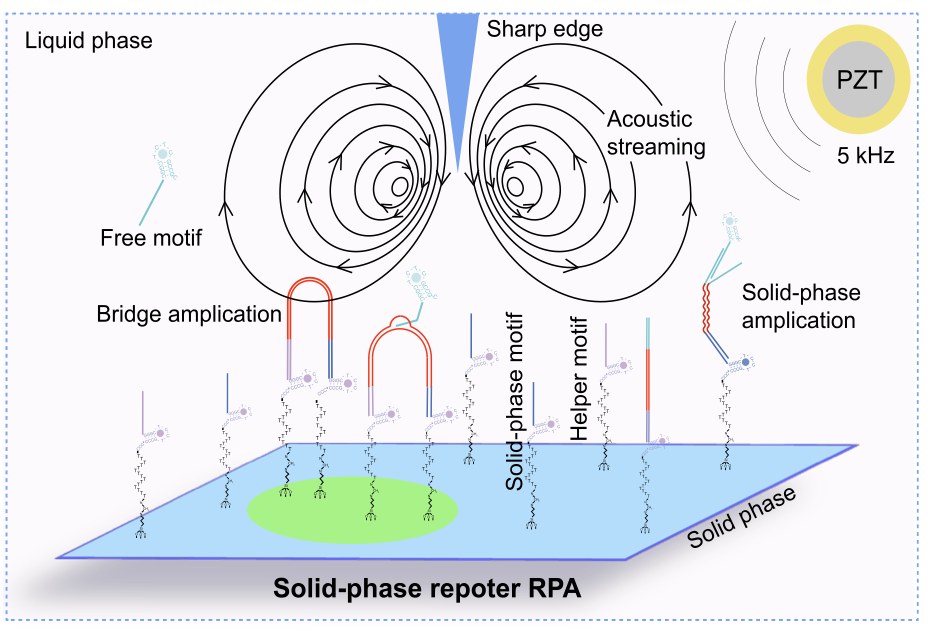
Inside the chip, a piezoelectric transducer drives acoustic streaming around sharp-edge microstructures. The sound sets up stable vortices that carry target molecules from the liquid to a reaction surface, where a solid-phase amplification reaction (reporter RPA) detects them.
In my talk I put it this way: turning “diffusion by luck” into “delivery by design.”
Sound on, sound off
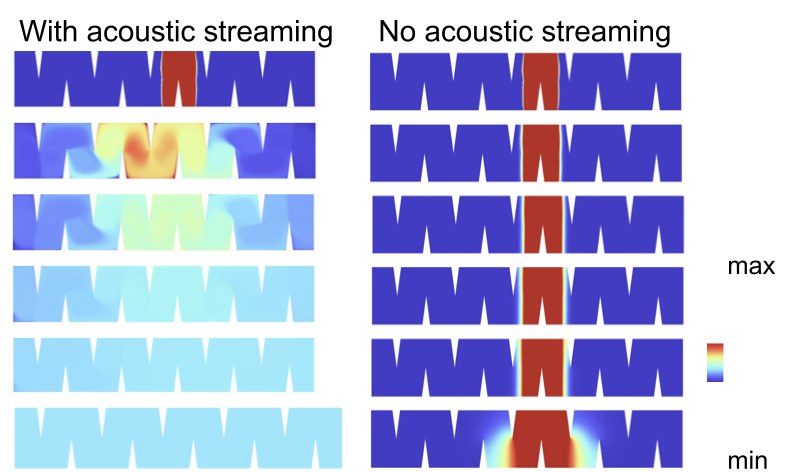
The comparison at the center of the project is simple: the same target and conditions, with the sound on and with it off. With streaming, the signal spreads across the whole reaction region within seconds. Without it, the reaction stays confined to where it began, even after a long wait.
In the lab experiments the two conditions were compared with time-resolved fluorescence images, tracking when the signal starts, how evenly it spreads and when it stabilizes. The figure here is a COMSOL simulation that I ran and drew.
Opening cells with sound
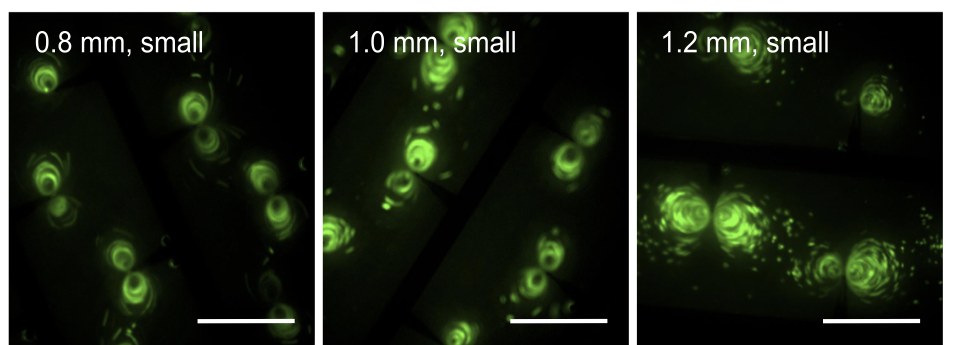
Sound can also open cells. Near the chip’s sharp edges the acoustic field makes cells rotate and deform. As the acoustic interaction length grows from 0.8 to 1.2 millimeters, the deformation increases, which the poster reads as more effective lysis, a way to release nucleic acids without chemical or heat treatment before amplification starts.
What the user would see
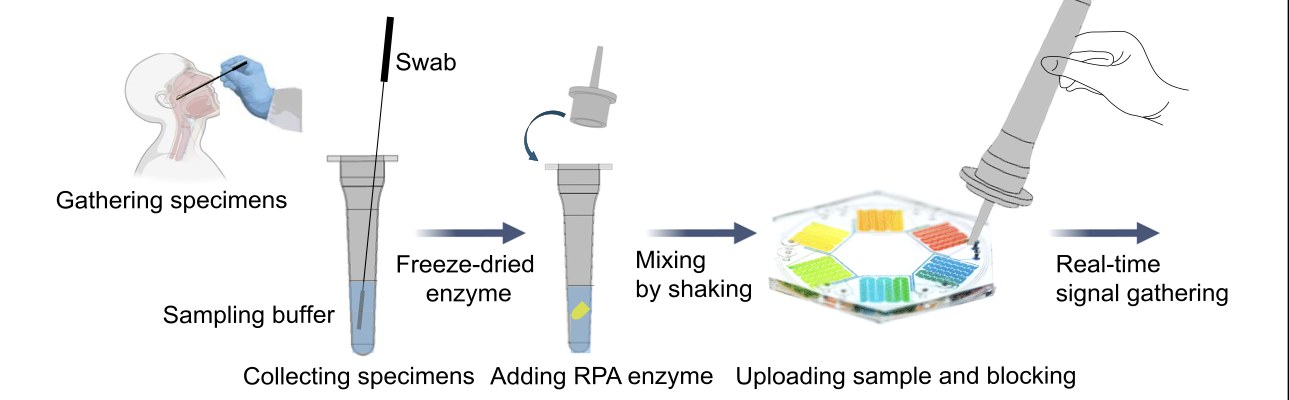
From the user’s side the test is meant to stay simple: collect a swab, add the freeze-dried enzymes, load the chip, read the signal. I drew the workflow so that someone outside the lab could follow it.
A concept for the result
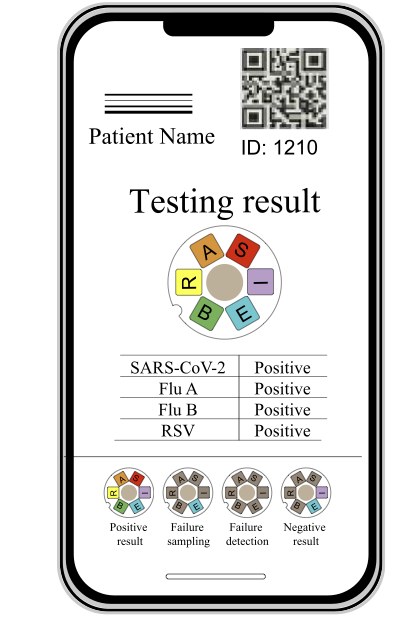
I also sketched how a result could appear on a phone: one cell per pathogen, with clear states for a positive result, a failed sample, a failed detection and a negative result. It is a design mock-up, not patient data.
Reading the signal
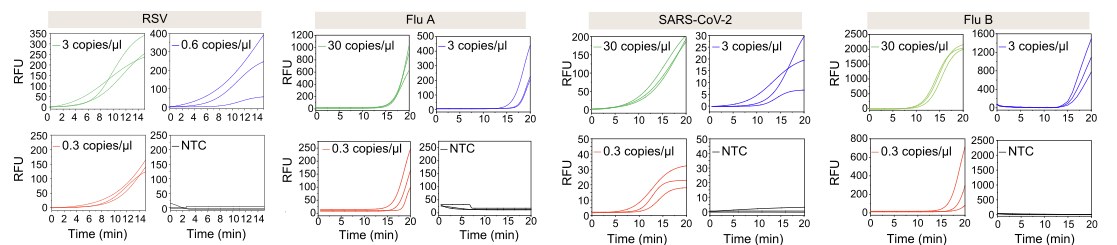
These amplification curves show the platform detecting RSV, influenza A and B and SARS-CoV-2 at several concentrations, down to 0.3 copies per microliter. I plotted them in Origin from the project’s experimental data.
The lab’s platform
- A PDMS microfluidic chip in which a piezoelectric transducer drives acoustic streaming around sharp-edge microstructures, developed in the Huang Acoustofluidics Laboratory at Duke.
- Reported results: a readout in 15–20 minutes and an analytical sensitivity of 0.3 copies/µL, for RSV, influenza A and B and SARS-CoV-2.
- The poster also reports comparisons with standard RT-PCR. I treat those as the project’s reported results, not as a clinical validation.
What I did
- Fabricated and bonded the PDMS devices with soft lithography, and worked on the sound-on versus sound-off experiments under my mentor’s supervision at Duke.
- Analyzed the platform’s diagnostic performance: how soon the signal starts, how evenly it spreads and when it stabilizes.
- Ran the COMSOL streaming simulation, and made the figures: the mechanism, workflow and result-screen graphics in Illustrator, the amplification curves in Origin, and the device and microscope images.
- Wrote the poster and the talk for the fair.
Where it standsPresented as a poster at the Science & Engineering Fair of Houston, 2025–26. The platform is research-stage work. In my talk the next steps are more pathogens, more kinds of sample and larger clinical validation.